Data study
AI Overview ads by industry (Oct 2026 data)
Ads around Google AI Overviews in 20 industries (Oct 2026): retail filled the top with product listings, while software, finance and travel ran text ads below.
By the AI Overview Ad Library team · Published · Updated · 7 min read
In short
- Eight retail industries produced 1,544 of the 1,917 ads we recorded (Oct 10–11, 2026, US searches), 1,442 of them product listings.
- Retail ads sat mostly above the AI Overview: from 55% of placed ads in Food & Grocery to 89% in Pets.
- Seven service industries, from software to insurance, ran only text ads, and most sat below: 27% above in Business Software, 39% in Personal Finance, none of 6 in Insurance.
- Ad rates by industry rest on few searches: our ad capture (searches run in a browser, where the ads on the page are recorded) ran 2 to 12 searches per industry, and 111 of its 149 searches showed ads.
- Google says it keeps finance out of ads inside AI Overviews; personal finance and insurance advertisers still ran 32 ads on results pages with one.
On this page · 9 sections
All 20 industries
We ran 528 signed-out Google searches from US connections on Oct 10–11, 2026, 17 to 31 in each of 20 industries, and kept every ad on the 138 results pages with ads. Fifteen of those searches showed no AI Overview; their 144 ads are counted below but have no position. Each industry has its own page in the library; the table links to them.
The ads come from two captures. The ad capture is searches run in a browser, where the ads on the page are recorded: 149 short searches, 2 to 12 per industry, which supplied 1,749 of the 1,917 ads. The answer capture is a second set of searches that recorded the AI answer and the sources it linked, but picked up ads on few of them (29 of 379); it supplied the other 168 ads. The table counts searches with ads in the ad capture only, and every ad from both.
| Industry | Ad capture: searches with ads | Ads | Listings | Placed above | Most ads |
|---|---|---|---|---|---|
| Sports, Outdoor & Fitness | 9 of 10 | 329 | 97% | 64% | KastKing (42) |
| Fashion & Footwear | 7 of 7 | 240 | 98% | 73% | DXL (37) |
| Home & Furniture | 6 of 6 | 228 | 92% | 68% | Cosori (27) |
| Pets | 7 of 7 | 219 | 92% | 89% | Chewy (33) |
| Consumer Electronics | 7 of 8 | 164 | 95% | 69% | Best Buy (32) |
| Food & Grocery | 9 of 12 | 154 | 79% | 55% | Hungryroot and two others (7) |
| Beauty & Personal Care | 3 of 5 | 107 | 94% | 67% | CVS Pharmacy (16) |
| Home Improvement | 7 of 7 | 103 | 94% | 82% | Home Depot (14) |
| Automotive | 6 of 7 | 73 | 55% | 22% | Carvana (14) |
| Travel & Hospitality | 8 of 9 | 53 | 38% | 27% | kimkim and REI (4) |
| Local Home Services | 5 of 9 | 51 | 59% | 66% | Cove Home Security (15) |
| Productivity & Creative AI | 6 of 10 | 34 | 32% | 13% | HP and mureka (3) |
| Business Software | 4 of 8 | 30 | 0% | 27% | NetSuite and Sage (4) |
| Telecom & Internet | 4 of 6 | 28 | 64% | 71% | T-Mobile (7) |
| Small Business Tools | 6 of 7 | 26 | 0% | 38% | Seven advertisers (2 each) |
| Personal Finance | 7 of 12 | 23 | 0% | 39% | Quicken and Forbes (3) |
| IT Security & Dev Tools | 4 of 5 | 22 | 0% | 32% | Five advertisers (2 each) |
| Media & Entertainment | 0 of 3 | 14 | 0% | 29% | StubHub (3) |
| Education & Careers | 4 of 9 | 10 | 0% | 1 of 3 | Ten advertisers (1 each) |
| Insurance | 2 of 2 | 9 | 0% | 0 of 6 | Two advertisers (2 each) |
Two groups stand out. Retail industries bought product listings and appeared mostly above the AI Overview. Software, finance and other service industries bought text ads and appeared mostly below it. The industries in between, from automotive to telecom, mixed both.
Retail: listing carousels above the AI Overview
Eight industries, from Sports, Outdoor & Fitness to Home Improvement, produced 1,544 ads, and 1,442 of them were product listings. Their pages were the largest in the library and their ads leaned above the AI Overview, from 55% in Food & Grocery to 89% in Pets. Big retailers led several of them: Chewy and PetSmart in Pets, Best Buy and Walmart in Consumer Electronics, Home Depot, Ace Hardware and Lowe’s in Home Improvement.
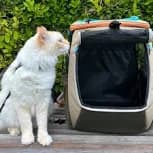
- Cat carrier, in pet carriers: 39 listings from 14 stores, all above the AI Overview, and no text ads.
- Toro snow blower, in snow blowers: 34 listings above, then a single text ad below from Ace Hardware, “Ace Hardware® Official Site - Toro Snow Equipment”.
- Yoga mat ran the other way: all 39 listings and both text ads sat below the AI Overview. So did most of nespresso pods (23 of 24).
Food & Grocery was the most text-heavy retail category, with 32 text ads. On meal kit delivery, HelloFresh, Marley Spoon, Hungryroot and Factor ran text ads beside a Forbes ranking. Each industry has a full report, such as the pets report, and Shopping ads around AI Overviews covers how the listings get there.
Software and business services: text ads, mostly below
Business Software, IT Security & Dev Tools, Small Business Tools, Personal Finance, Education & Careers, Media & Entertainment and Insurance ran no product listings at all. Their ads were text ads, and most sat below the AI Overview: 8 of 30 above in Business Software, 7 of 22 in IT Security, 9 of 24 placed in Small Business Tools. Productivity & Creative AI, which also had a few listings, placed only 4 of 31 above.
- ERP systems, in ERP software: NetSuite (“Compare ERP Software”) and Sage (“Best ERP Systems”) above; Sage, Acumatica, Campfire and NetSuite below.
- Web app pentest, in penetration testing services: four ads, all below, including Astra (“OWASP-Based Web Pentesting”), Red Sentry and CodeAnt AI.
- Review request app, in review management: Birdeye above, then Birdeye, SoTellUs, Jobber, Bazaarvoice and AppLift below.
Some of these ads come from the answer capture, whose recorded ads sat mostly below the AI Overview (129 of the 161 we could place): 12 of Business Software’s 30 ads, 10 of IT Security’s 22 and 21 of Productivity & Creative AI’s 34. So part of the low share above may reflect the capture, not the industry alone. In the ad capture by itself, 5 of 18 Business Software ads and 3 of 12 IT Security ads sat above. Which searches show AI Overviews and ads explains the two captures.
Travel, automotive and local services: a mix
Automotive and Local Home Services ran both formats around AI Overviews. Travel & Hospitality had 33 text ads and 20 listings, but all 20 listings came from aer travel pack, a search with no AI Overview; only 9 of the 33 placed text ads sat above. On google hotels, in hotel booking sites, all five ads were below: trivago twice, IHG, Priceline and Hilton. Automotive placed 9 of 41 above. On minivans, Toyota, Chrysler and a Honda dealers’ ad sat above, while 20 vehicle listings, Carvana (“Best Minivans To Buy”, used minivans from $16,590) and Volvo sat below.
Local Home Services looks retail-like only because of one page: 23 listings, 15 of them Cove’s own, sat above the AI Overview on cove security. Its text ads were local and mostly below. On are emergency plumbers worth the extra cost, in plumbers, five ads from two local plumbing firms and Angi all sat below. Telecom & Internet split the same way: 18 phone listings above on bogo phone deals, but on 4 line plans Mint Mobile’s family plan was the only ad above and Verizon’s “Simplicity Plan” was among four below.
Finance and insurance: ads above and below the AI Overview
Google’s help page says: “Currently, we don’t show ads in AI Overviews for sensitive verticals like adult, alcohol, gambling, finance, healthcare, politics, and more.” That covers ads inside the AI Overview. Ads above and below are ordinary Search ads, and in our capture finance advertisers used them: Personal Finance had 23 text ads on 8 results pages, 9 filed above and 14 below, and Insurance had 9 on 3 pages, none above. An inside position is not recorded, so our records cannot say whether any of these sat inside the AI Overview. In the ad capture, 7 of the 12 Personal Finance searches and both Insurance searches showed ads.
- CIT money market, in money market accounts: E*TRADE above; WECU (“4.25% APY* Certificate”) and EverBank (“4.20% APY Savings Account”) below.
- ARM mortgage rates, in mortgages: Rocket Mortgage, Forbes and Angel Oak, all below.
- Renters insurance online, in renters insurance: two ads from a State Farm agent and one from Horace Mann, all below.
The other 5 Personal Finance searches in the ad capture showed no ads, among them capital one auto, better mortgage and spousal ira. Finance searches that ran only in the answer capture, such as personal loans and car insurance quotes, had no ads recorded, which does not show whether Google puts ads on them.
Using the industry view
- Retailers: the top of the page is mostly a Shopping question. Compare your stores with the leaders in your industry’s page and report, and see ads above vs below AI Overviews for how the positions are filled.
- Software and services: expect to compete below the answer, often with comparison and review sites such as Forbes, and write for someone who has read the AI Overview.
- Finance and other sensitive categories: Google says it does not show ads inside AI Overviews for these verticals, so plan for the positions above and below.
- Read the numbers as a sample. 17 to 31 searches per industry, only 2 to 12 of them in the ad capture, which is where the ad rates come from. Counts are “at least”, not market share. Alerts tell you when we publish new ads in your industry.
Examples from the library
4 of the ads on searches this guide links to, in our capture (Oct 10–11, 2026, US searches). Each card shows the search that brought it.
 Ace HardwareSponsored
Ace Hardware® Official Site - Toro Snow Equipment
Keep Your Sidewalk and Driveway Clear. Shop Toro Snow Blowers & Equipment at Ace®.
 Yoloha YogaSponsored
World's First Cork Yoga Mat
The highest quality and performing natural cork yoga products on the market.
 $159.95Product
"The Navigator" Earth Convertible Cat Backpack – Breathable Mesh On All Sides | Travel Cat
Above the AI Overview
Searched for
PetsOct 11, 2026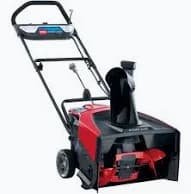 $749Product
Toro FLEX FORCE 21in Power Clear Snow Blower Kit 60V MAX 7.5Ah Battery Charger - 39901
Above the AI Overview
Searched for
Home ImprovementOct 11, 2026

Questions and answers
Which industry has the most ads around Google AI Overviews?
Sports, Outdoor & Fitness, with 329 ads in our Oct 10–11, 2026 US capture, 320 of them product listings (28 of them on lew’s baitcaster, a search with no AI Overview). KastKing placed the most (42), 41 of them on a search for its own reels.
Do finance and insurance ads appear around AI Overviews?
Above and below, yes: we recorded 23 personal finance and 9 insurance text ads on pages with an AI Overview. Google says it doesn’t currently show ads inside AI Overviews for sensitive verticals including finance; this edition does not record an inside position.
Which industries’ ads sit above the AI Overview?
Retail ones, through product listings: 89% of placed ads in Pets and 82% in Home Improvement. Text-ad industries sat lower: 27% above in Business Software and 13% in Productivity & Creative AI.
Why did some industries show so few ads?
Mostly because few of their searches ran in our ad capture, where the ad rates come from: 3 of Media & Entertainment’s 22 searches and 9 of Education & Careers’ 26. None of those 3 showed ads, and 4 of the 9 did. The rest ran only in our answer capture, which under-records ads, so their ad rate was not measured.
Sources
- About ads and AI Overviews – Google Ads Helpsupport.google.com
- About Shopping ads – Google Ads Helpsupport.google.com
- About Ad Rank – Google Ads Helpsupport.google.com
- AI Overview ad statistics – AI Overview Ad Libraryaioverviewadlibrary.com
- Methodology – AI Overview Ad Libraryaioverviewadlibrary.com
Figures from the library are in our capture (Oct 10–11, 2026, US searches) and describe what we observed, not Google’s full ad inventory. See how the ads are captured. AI Overview Ad Library is independent and not affiliated with Google.